The question
Clubs often replace a manager after poor results, but a later improvement is hard to attribute. Teams are usually replaced after a bad run, and a bad run tends to be followed by a better one anyway, so before-and-after results cannot be read as the effect of the change. This was a Technion causal-inference course project in Spring 2024, submitted by a team of three. I proposed the question and carried out the data assembly and analysis myself.
How I built the data
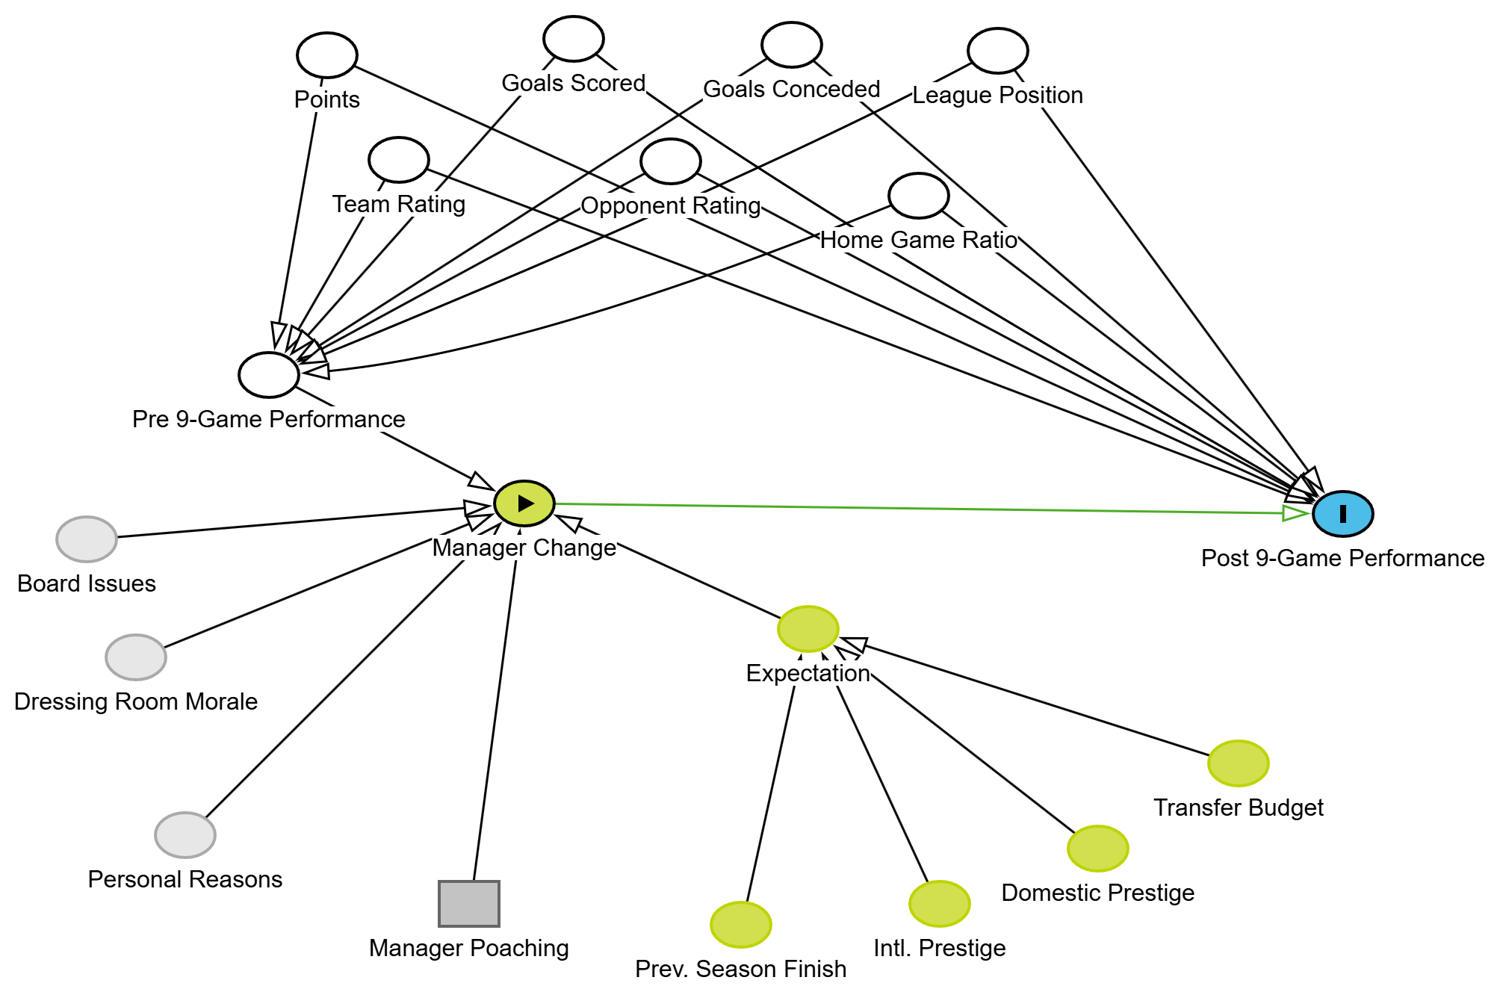
No single dataset covered the question, so I assembled one. Results for the 3,420 Premier League matches from 2014/15 to 2022/23 came from a public Kaggle dataset. Club quality, prestige and transfer budget came from a second Kaggle dataset derived from the FIFA video game, joined to each match by the nearest update date. No structured record of managerial changes exists, so I took the dates from Transfermarkt and encoded them by hand onto the fixtures, removing cases where a manager left because another club hired them, since those are not dismissals. Weekly league tables were not available either, so I reconstructed a running table from the results. For each change I then built a window of up to nine matches before and after it. For comparison I sampled windows of the same size from team-seasons without a change, with each team appearing at most once per season. The result is 181 team windows, 50 of them treated.
What I found
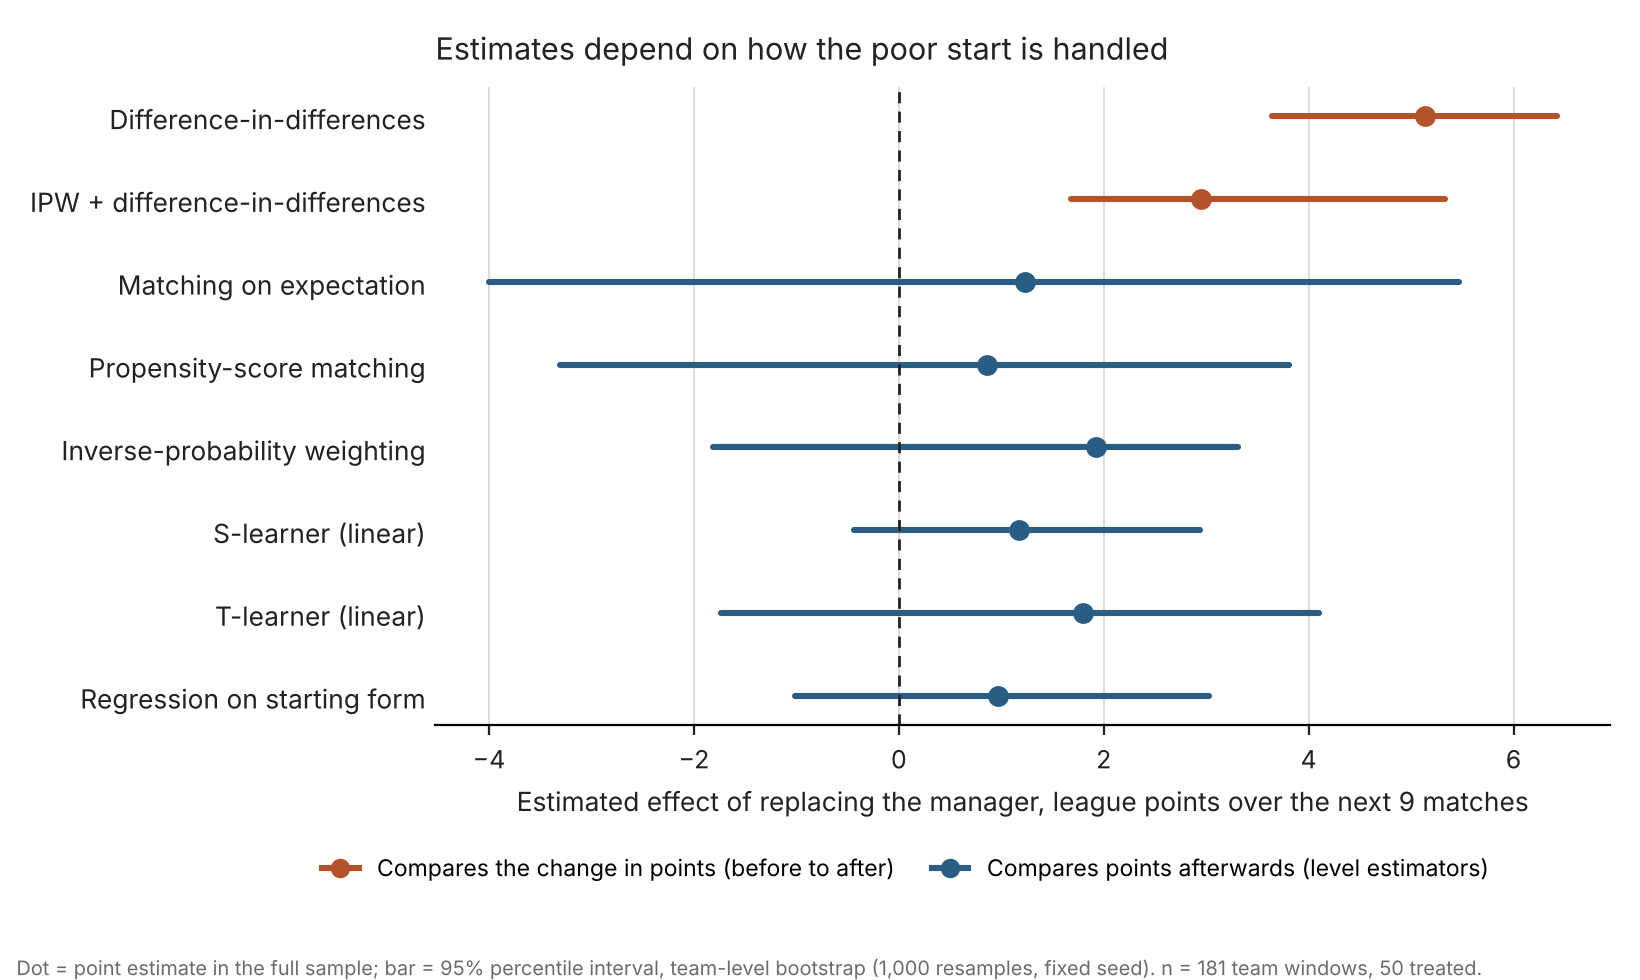
Teams that replace a manager have usually just had a bad run. In this data the treated teams averaged 6.6 points in the nine matches before the change, against 13.5 for the comparison windows. Comparing the change in points therefore gives a large gain, about five points over nine matches. But comparison windows that also started with eight points or fewer (22 of them) gained 3.7 points with no change of manager, so most of that gain is a rebound. Both change-based estimators exclude zero, which is what a rebound would produce. Estimators that compare points afterwards give 0.9 to 1.9 points, and none of their 95% intervals excludes zero; the regression on starting form gives 1.0 points (interval -1.0 to 3.0). The data are consistent with a small benefit and equally with none.
Estimates depend on how the poor start is handled
Dot = point estimate in the full sample; bar = 95% percentile interval. 1,000 bootstrap resamples, fixed seed. n = 181 team windows, 50 treated.
- Compares the change in points (before to after)
- Compares points afterwards (level estimators)
Show the numbers as a table
| Estimator | Compares | Estimate (points) | 95% interval | Excludes zero |
|---|
Data: rerun/results.csv, regenerated exactly by rerun.py.
The course report flagged the change-based result as suspect. For this page I reran everything with league points as the outcome, fixed random seeds and a bootstrap that resamples whole teams, and I now read that result as selection on a poor start. A scaling inconsistency I found in my original composite score shifted both groups almost equally and changed no conclusion.
What I would do today to make it a real system
To take this from coursework to something a club could rely on, I would change five things. First, replace the video-game ratings with point-in-time data such as match events and expected goals, so that no feature is measured after the match it describes and the outcome is less noisy than points. Second, compare each manager change with matched team-moments that share the same recent form and fixture difficulty, instead of random windows, and extend to more seasons and leagues so that the sample is more than 50 events. Third, fix the outcome and the estimand before looking at results, and report effects in points per game with team-level intervals. Fourth, move the data build into a tested, versioned pipeline with automated validation and leakage checks. Finally, serve it as a forecast of the next matches under "keep" and "replace", validated on later seasons and unseen leagues and monitored for calibration as matches arrive, with the unmeasured confounding stated next to every number.
- Code and notebooksCausal-inference analysis of midseason Premier League manager replacements and team performance.
- Reproducible rerun used on this page